The image
You have 25 seconds to prepare and 40 seconds to speak.
Sample answer (69 words, about 35 seconds)
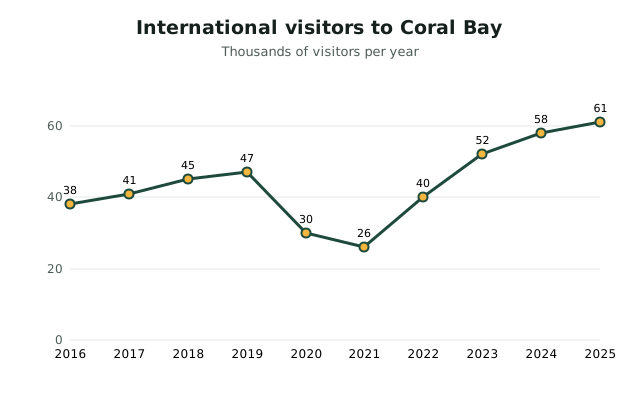
The line graph shows the number of international visitors to Coral Bay between 2016 and 2025, in thousands. Visitor numbers rose steadily from 38,000 in 2016 to 47,000 in 2019. They then fell sharply, reaching a low of 26,000 in 2021. After that, numbers recovered strongly, climbing to 61,000 by 2025, the highest point on the graph. Overall, despite a temporary drop, tourism to Coral Bay has grown significantly.
The structure behind it
- Introduce: "The line graph shows/compares…" (what, where, when)
- Main feature: the biggest, highest or most important thing
- Two details with numbers: one comparison, one change or contrast
- Conclusion: "Overall, …"
Keep a steady pace and don't stop for more than 3 seconds; a long pause can end your recording. Fluency and pronunciation count for more than describing every detail.
Practise it
Try this image yourself on the Describe Image practice page, which records your answer on your device and shows your start time and pauses. More: all Describe Image examples.